How date zoom works
When viewing a dashboard, click the Date Zoom dropdown to select a granularity (Day, Week, Month, Quarter, Year). All charts with date dimensions will update to show data at that granularity.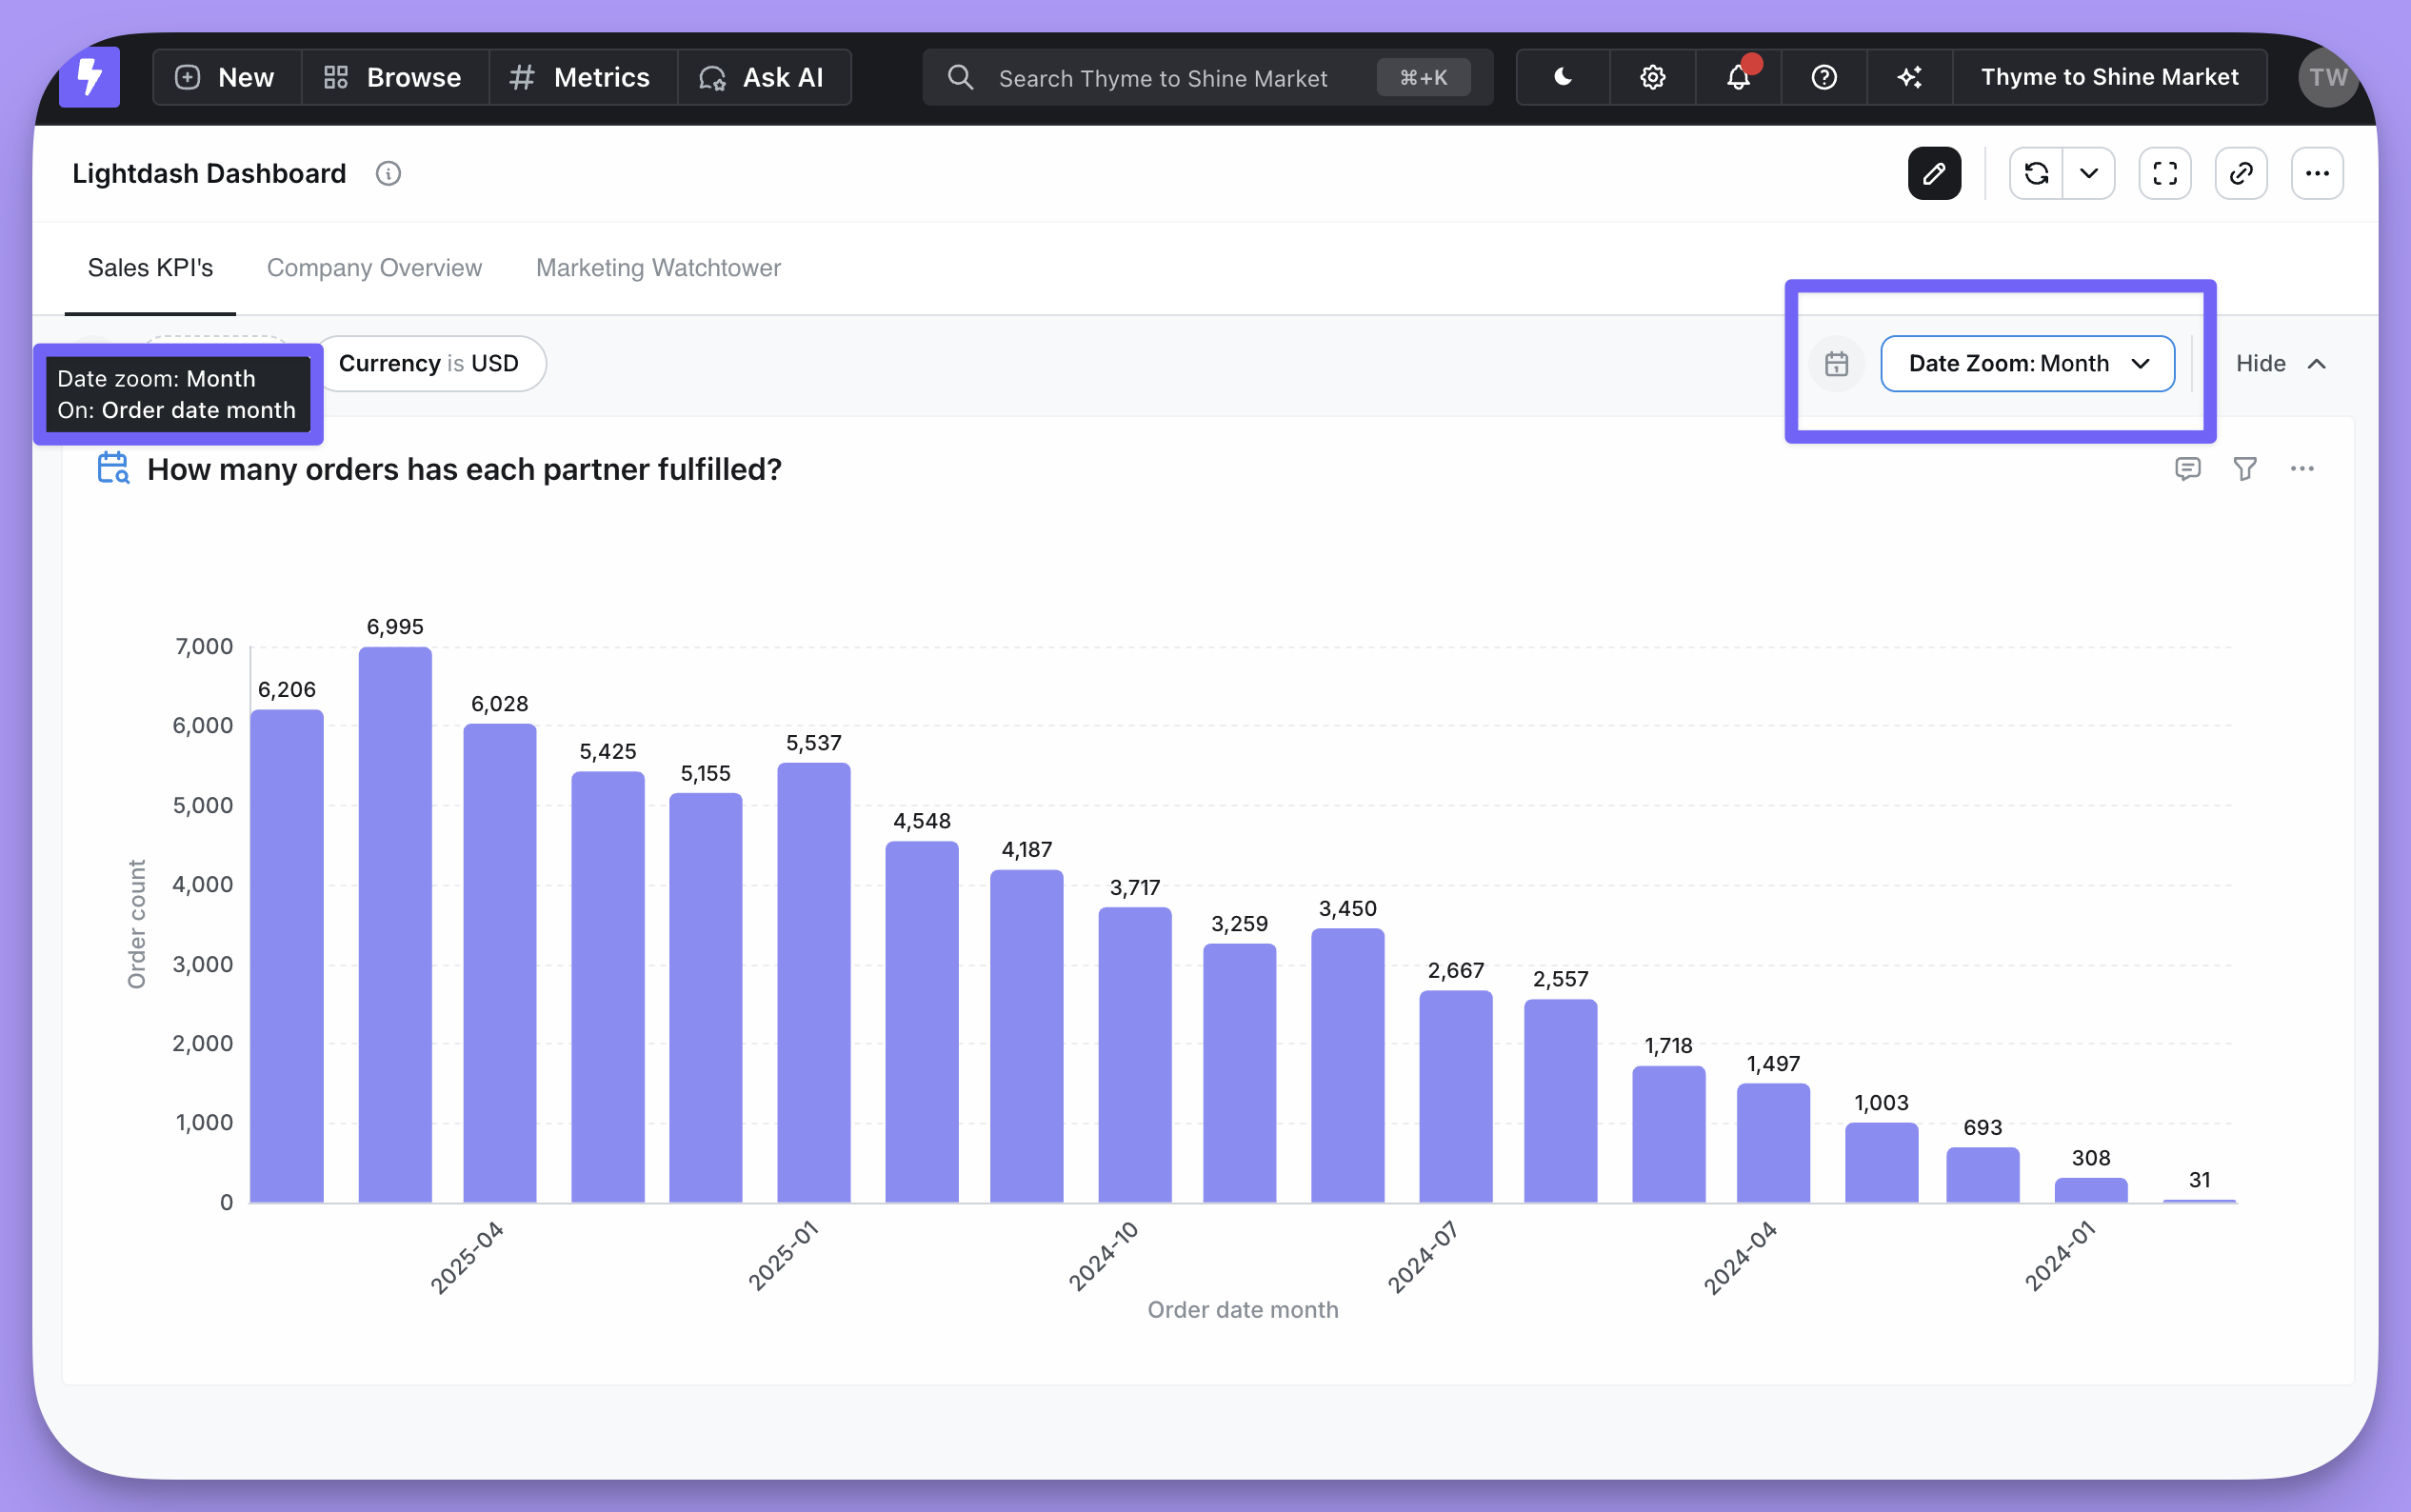
- Applies to charts with at least one date dimension in the results
- If a chart has multiple date dimensions, date zoom uses the first (left-most) dimension
- Changes are temporary—refreshing the dashboard restores the original granularity
- You can see which dimension was affected by hovering over the indicator on each tile
Configuring available granularities
Dashboard editors can customize which granularities appear in the date zoom dropdown and set a default.Setting available granularities
- Open the dashboard in edit mode
- Click the Date Zoom dropdown
- Click the pencil icon to enter edit mode
- Use the checkboxes to enable or disable granularities
- At least one granularity must remain enabled
- Save the dashboard to persist your changes
Setting a default granularity
You can pin a granularity as the default that’s automatically applied when the dashboard loads:- In date zoom edit mode, click the pin icon next to a granularity
- The pinned granularity becomes the default
- Click the pin again to remove the default
Default granularities don’t apply when the dashboard is loaded with a granularity already specified in the URL.
Using custom granularities
Custom granularities defined in yourlightdash.config.yml appear in the date zoom dropdown alongside standard options. This is useful for business-specific time periods like fiscal quarters or custom week definitions.
Custom granularities appear below a visual divider in the dropdown, using their configured labels.
To use custom granularities in date zoom:
- Define the granularity in
lightdash.config.yml:
- Reference it in your dimension’s
time_intervals:
See custom granularities configuration for the full reference and dimensions reference for more examples.
Removing date zoom from a dashboard
To prevent users from changing date granularity:- Open the dashboard in edit mode
- Click the X on the Date Zoom dropdown
- Save the dashboard
Date zoom in embedded dashboards
Date zoom can be enabled or disabled in embedded dashboards using thecanDateZoom option in your JWT token: